Call Analytics That Show Patterns You Already Suspected
We built call analytics because watching managers guess about call volume, agent performance, and service levels based on vibes instead of data seemed like a problem.

99.99% Uptime
Two-node HA cluster with automatic failover. Not a joking matter.
Flexible Contracts
Month-to-month. Because locking you in for years doesn't inspire great service.
Real Support
Actual humans answer. It's a 9 second support wait. We measured it. Not making it up.
2500+ Businesses
Using our phones to take calls right now instead of filing support tickets.
What's Broken & How We Fix It.
No Visibility
You don't know how many calls are waiting until someone complains about hold times.
Agents Not Performing
You think some agents perform better than others but you can't prove it with data.
Solution Guessing
Monday mornings are chaos but you don't know if it's volume, staffing, or something else.
After-The-Fact Problem
You discover missed calls and service level failures when reviewing yesterday's reports.
What You Get
Live Volume Dashboards
Real-time view of calls waiting, calls connected, and calls abandoned as they happen.
Agent Performance
Automatic tracking of talk time, handle time, calls per hour, and productivity metrics.
Historical Trends
Track call patterns over days, weeks, or months to identify trends and forecast needs.
Service Monitoring
Track whether calls are answered within target timeframes and see compliance in real-time.
Missed Call Tracking
See every missed call with timestamp, caller ID, and which agent was supposed to answer.
Custom Metric Alerts
Get notifications when metrics exceed thresholds you define for intervention.
Call Disposition Reporting
Track call outcomes, categorize interactions, and measure resolution rates automatically.
Exportable Reports
Download data for external analysis, executive reporting, or integration with other systems.
Peak Time Identification
Automatic detection of busiest hours and days so staffing matches actual demand patterns.
- The AI Is Already Running
AI-first since 2016. Live today, not on a roadmap.
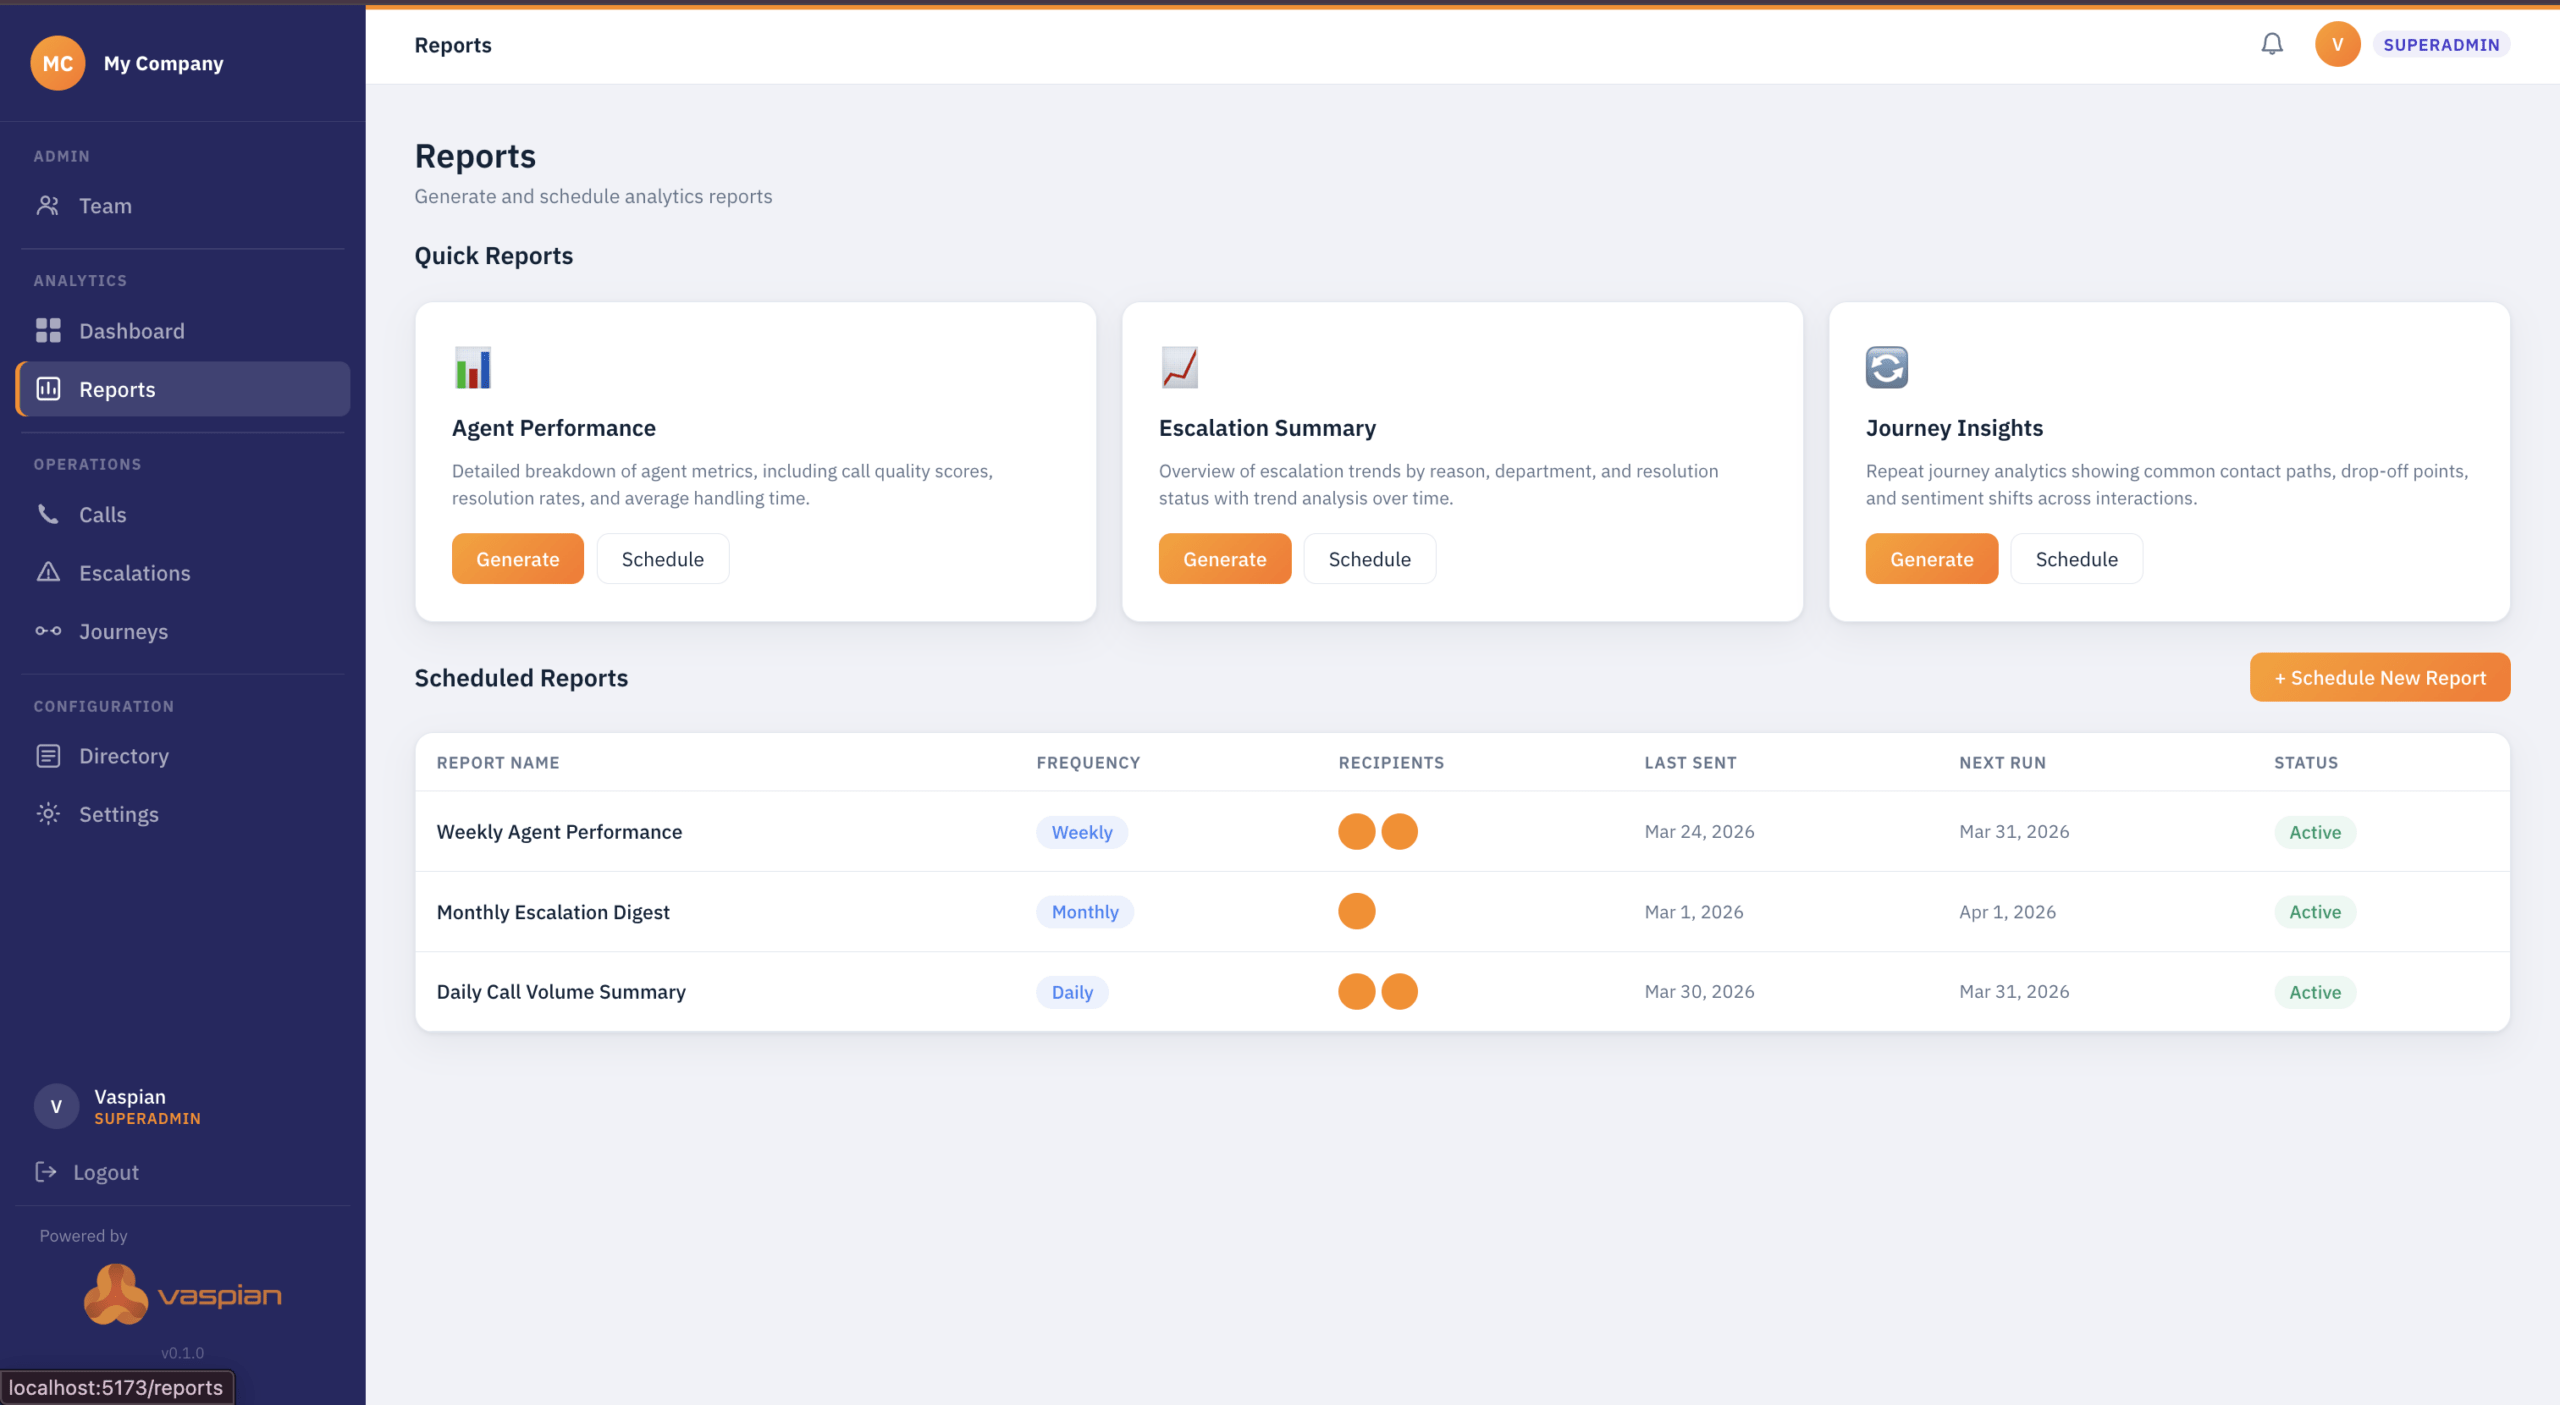
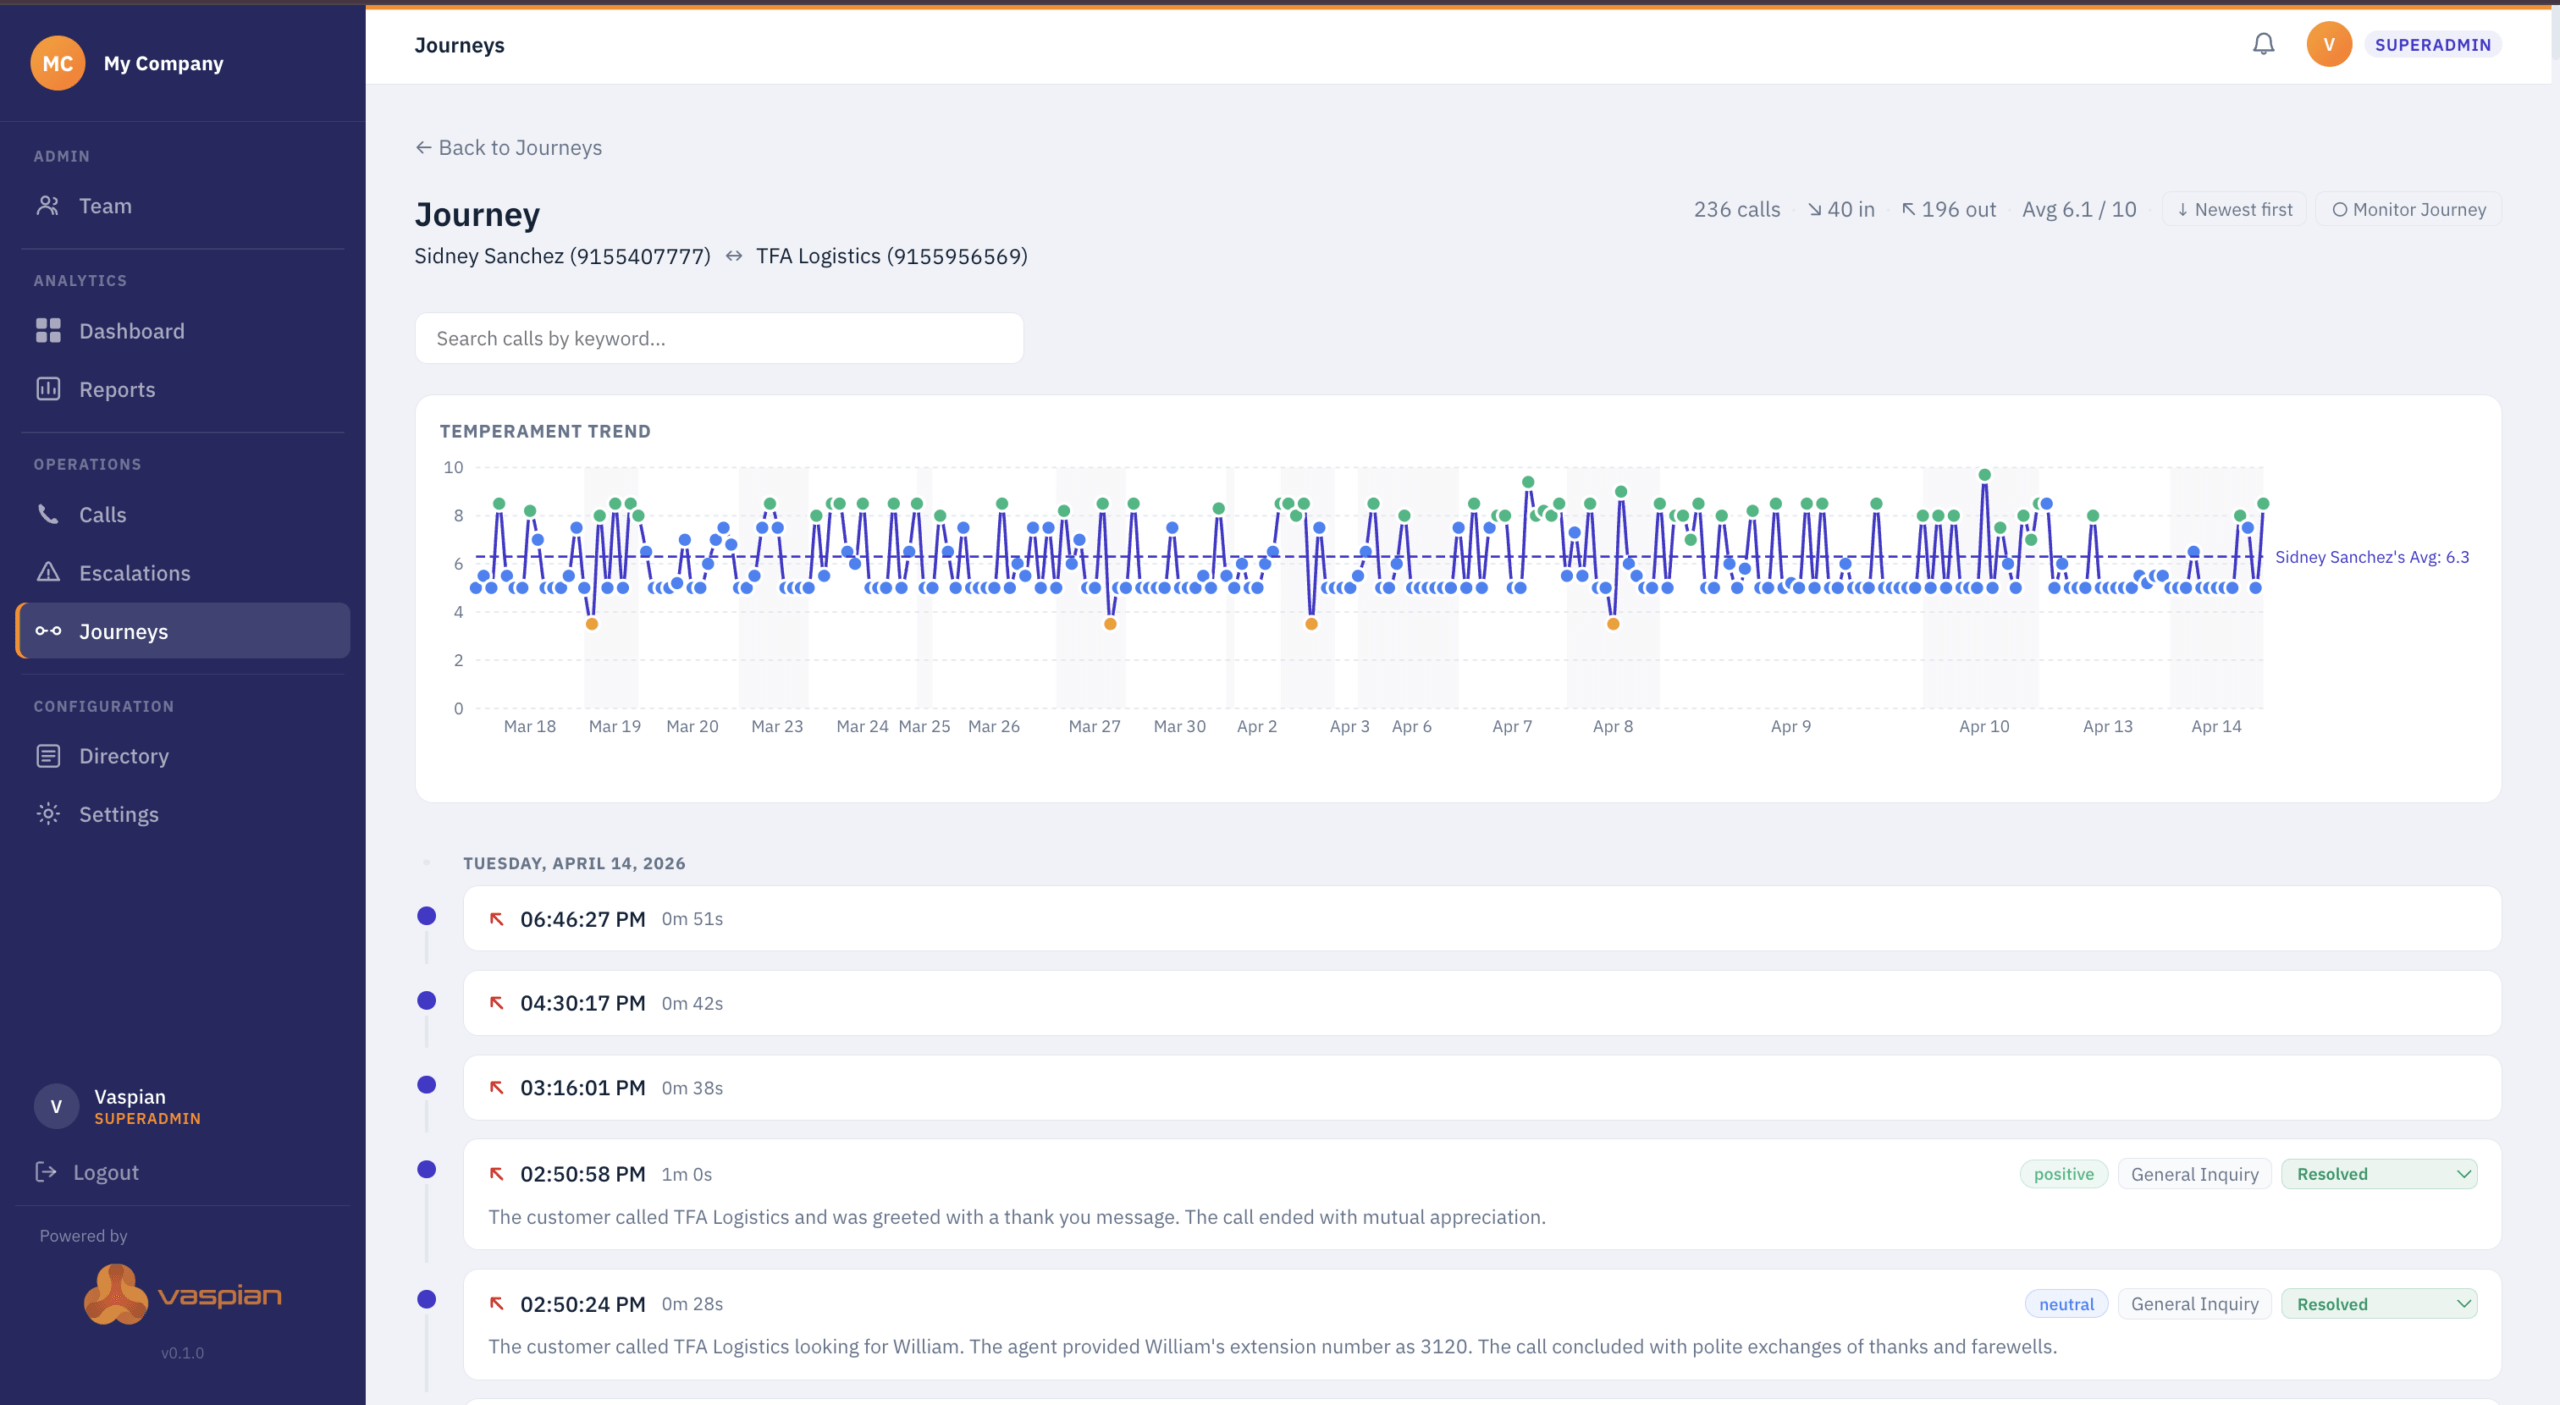
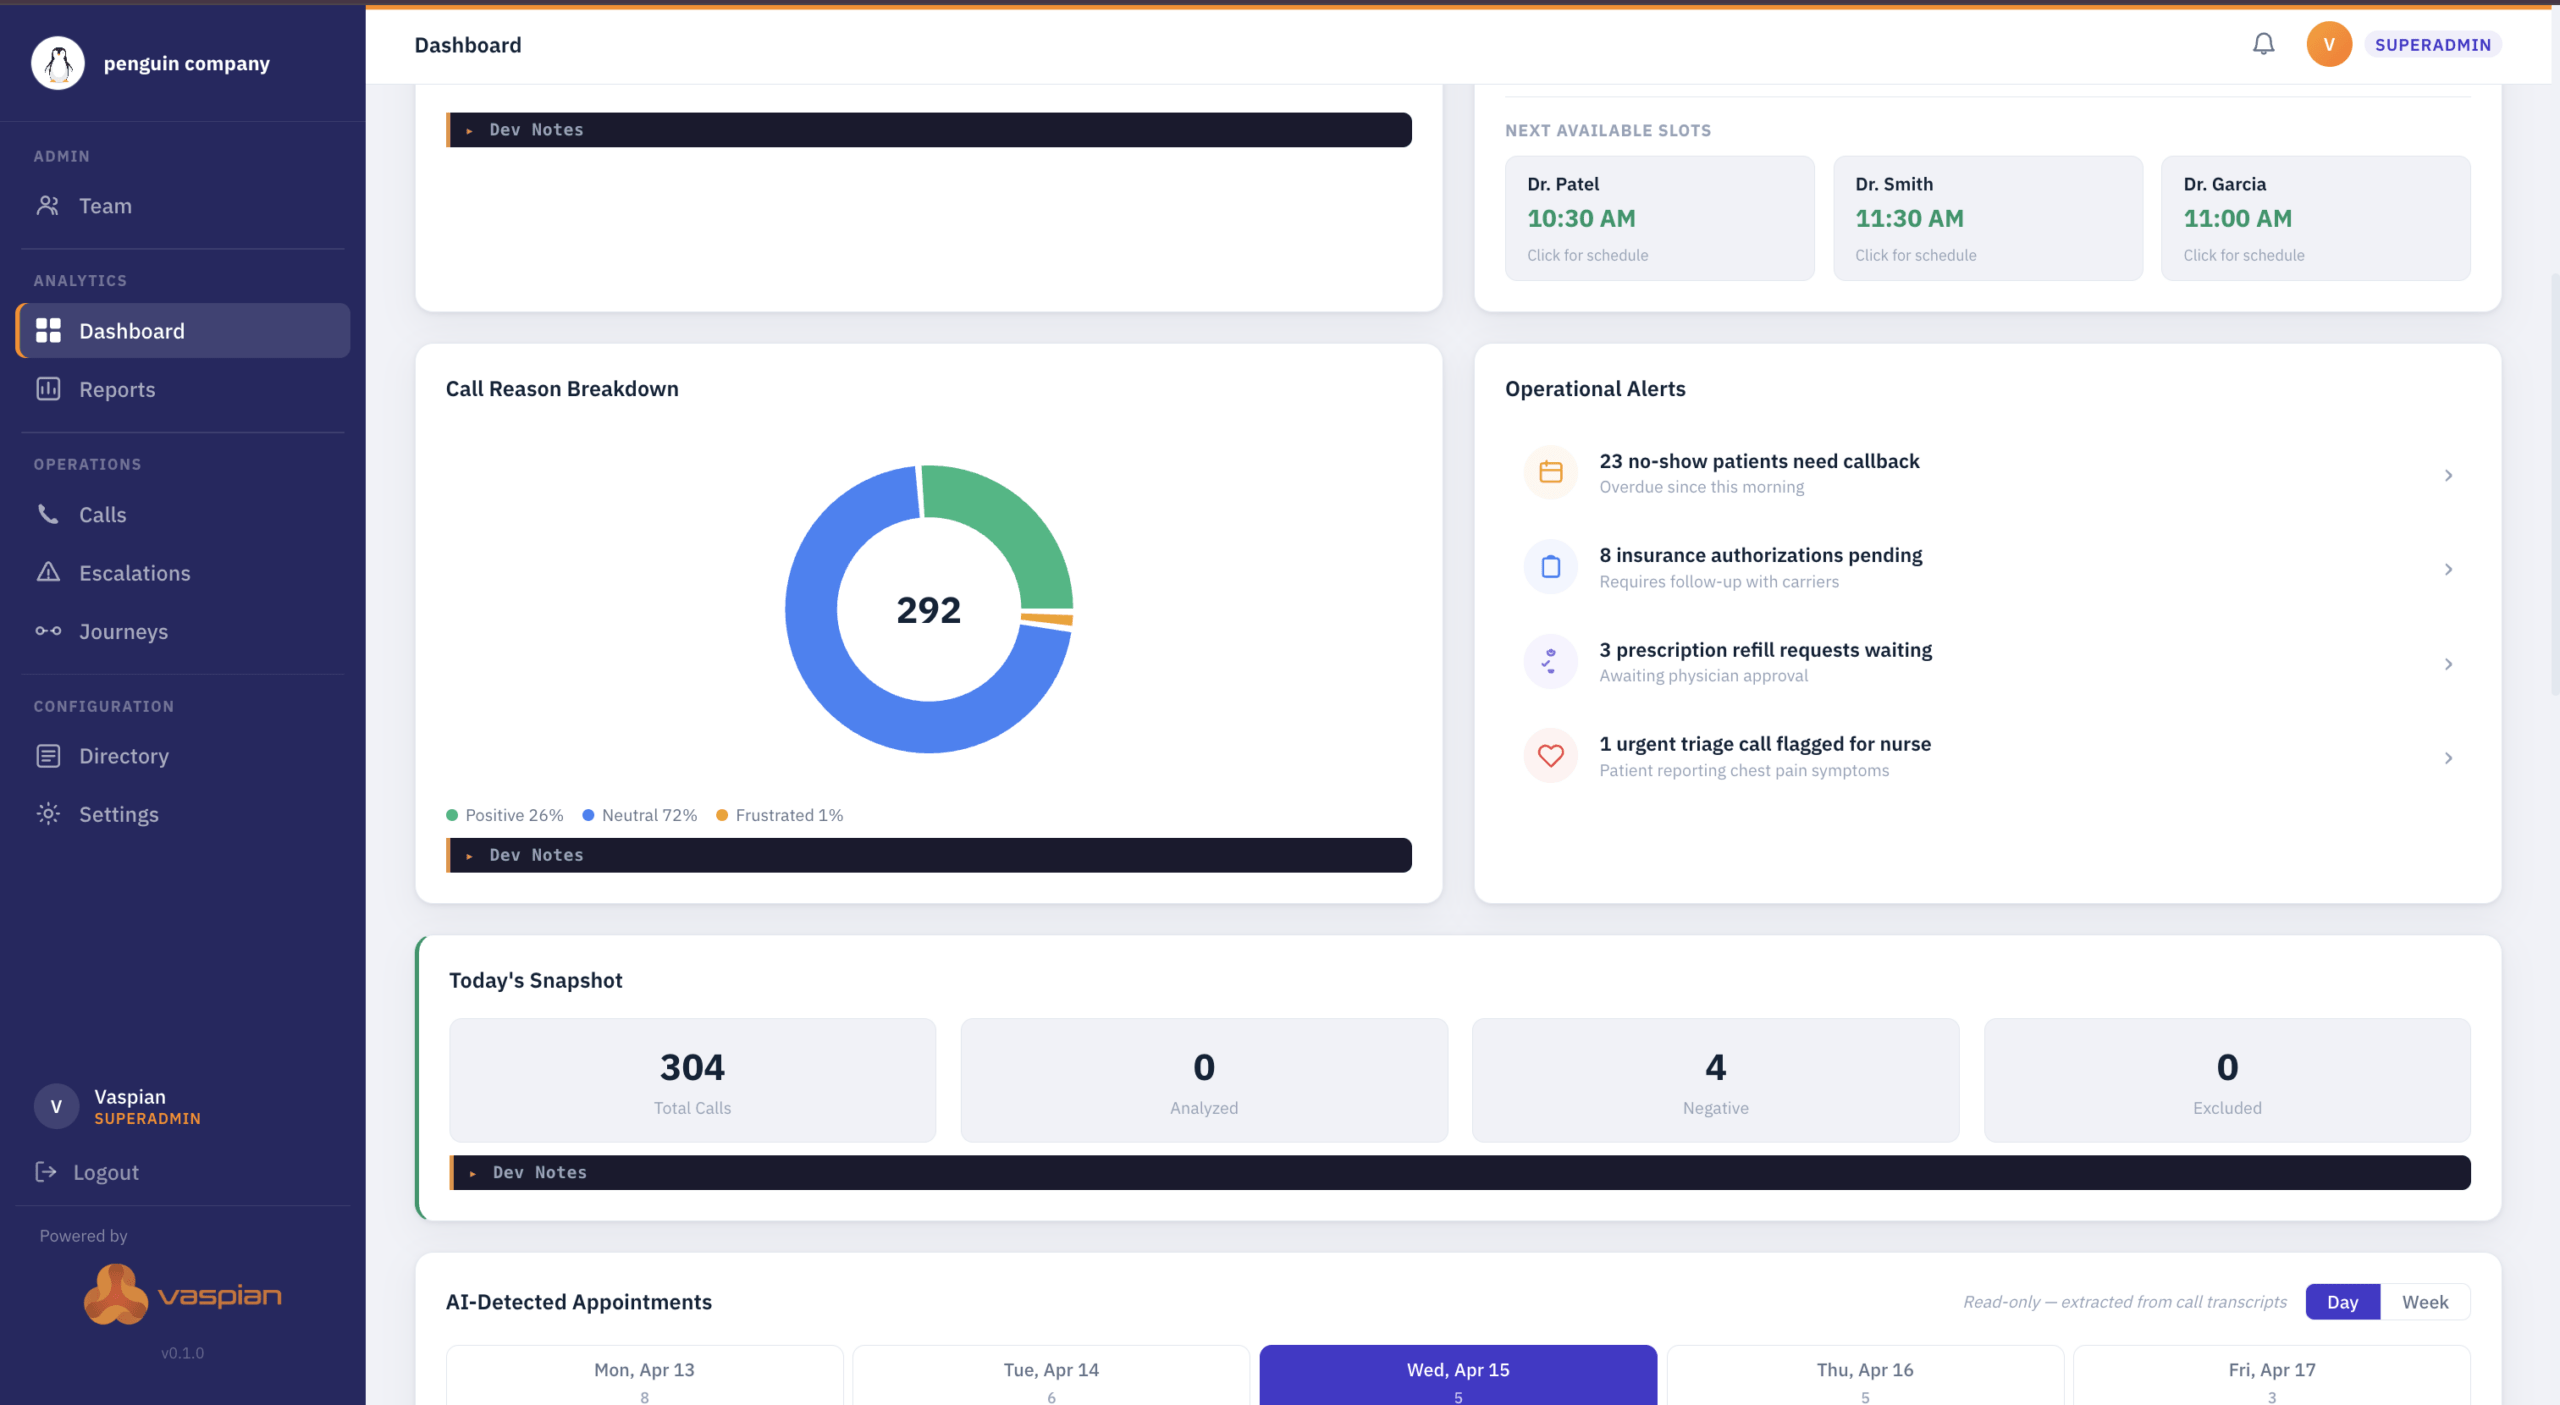
All Communications In One Place.
The actual Vaspian One interface your team uses. Dashboard shows message volume, response times, and conversation analytics. No surprises. This is what you're getting.
Our Pricing Plan
- Custom Quote
- Not "starting at" pricing that quadruples after you sign up.
- Real-time dashboards with live call metrics
- Agent performance tracking
- Historical trend analysis
- Service level monitoring with goal tracking
- Missed call tracking with caller ID
- Custom metric alerts via email or SMS
- Call disposition reporting and first-call resolution
- Exportable reports (CSV, PDF) with scheduling
- Wallboard displays for team visibility
- Works with Vaspian phone system
Why It Actually Works
Problems Caught Early
Real-time visibility means intervention during problems, not discovery after they're over.
Agent Coaching
Performance metrics identify who needs help and what kind of help they need.
Historical Lookup
Historical patterns show exactly when you need coverage instead of guessing.
Accountability Charts
Metrics show who's performing and who's not without manager surveillance.
Ready To Actually Know What's Happening?
Most managers figure out call analytics reveals things they didn't know within the first week. Usually within the first day. Occasionally within the first hour when they see real-time queue depth and realize they've been understaffed during lunch rush for months.

Common Questions
Find quick answers to the most common questions about our courses and platform.
What's the difference between call analytics and speech analytics?
Call analytics tracks the numbers: how many calls, how long they lasted, who handled them, when they happened, and whether service levels were met. Speech analytics analyzes what was actually said on calls using transcription and AI. Call analytics is about metrics and dashboards. Speech analytics is about words and sentiment.
Do agents see their own performance metrics?
Depends on how you configure it. You can give agents access to their own dashboards showing their personal metrics without seeing team averages. Or restrict dashboards to supervisors only. Most operations show agents their own data to encourage self-improvement.
How far back does historical data go?
Typically 12-13 months of detailed call data available for analysis. Older data can be archived or exported if you need longer retention for compliance. System maintains granular data (individual call records) for recent months and aggregated summaries for older periods.
Can we track metrics by campaign or department?
Yes. Call analytics segments data by whatever categories matter to your operation: department, campaign, agent group, phone number called, time of day, or custom tags. See performance broken down by segment instead of just overall averages.
What happens if internet goes down?
Calls keep working (assuming proper failover configuration), but real-time dashboards won’t update until connectivity restores. Call data logs locally and syncs when connection returns. No data loss, just temporary dashboard unavailability.
Can we set different alert thresholds for different times?
Yes. Configure different thresholds for peak hours vs slow hours. Alert when queue exceeds 10 during lunch rush but only 5 during morning. Set service level goals of 80% during normal hours but 90% during slow periods.
How do historical reports help with forecasting?
Historical patterns show seasonal trends, day-of-week patterns, and time-of-day fluctuations. Last December averaged 30% more calls than November. Use this data to forecast next December staffing needs. Reduces guessing about future capacity requirements.